Measuring the lead time is one of the three core means of Kanban (next to Workflow visualization and WIP limitation). But whereas Workflow visualization and WIP limitation are easy to understand for the team, I experienced that nobody really cares about what to do with Measuring the Lead Time. This week I tried a different approach visualizing the Lead Time and got instant feedback from the team.
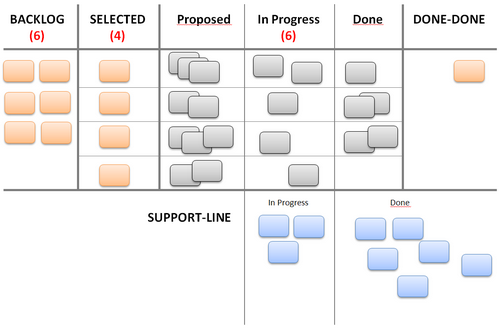
One of our team is working with a two tier Kanban with an additional fast lane for immediate support tickets (similar to a bug line).
It looks like this:

We measure the lead time for the orange tasks as well for the blue tickets; Lead time clock starts from the moment the tasks/tickets are moved to In Progress and stops when they are moved to Done (blue tickets) / Done-Done (orange tasks).
We are not starting the clock when the ticket or task has been created (as described in Stefan Roocks Post), although this seems very reasonable especially for requirements from other teams.
Why measuring the lead time?
In theory, the goal is to make the lead time as small and predictable as possible by optimizing the process.
In reality, nobody here really seems to be interested in the lead time, even though I’m sending out a report every 4 weeks that is also printed out and pinned to the team’s board. It shows an overview of all finished tasks/tickets visualized in some charts. Most probably my report doesn’t make sense to them.
As a consequence I tried a rebrush of the report this week.
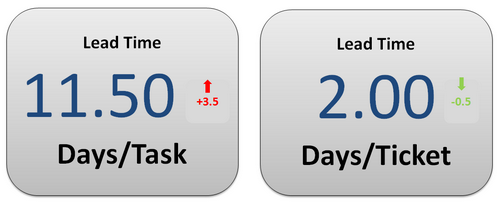
It now starts with a chart like this:
 I got fast and positive feedback from the team: What does the lead time say exactly? … Interesting number! It’s good that we have a number like this! … Now I understand why all tasks should have about the same size and why we have to break down the tasks into smaller batches …
It seems as if it only needed a (simple) visualization of the lead time to get the team’s attention. Now that I have the team’s attention we can start to make the lead time as small and predictable as possible.
BTW: A much better agile coach than I am suggested to use the median of the lead time and not the average. This defintely makes sense!