This post is a wonderful example of me being a project manager struggling to become an agile coach:
As a project manager I loved to show the status of a project via traffic lights (see image below). I always pinned those traffic lights on the team board and every developer could move his or her name sign anytime on red, yellow or green, depending on the developer’s opinion.

Traffic lights are easy to understand for everyone (also for externals like management or other teams). Additionally I could quickly react and adjust the plan with the developers if most name signs were on “yellow” or “red”.
At the moment I work with a small Scrum team (2 developers and 1 UX), our Sprints are 3 weeks. So we actually require a Burndown Chart to show the teams progress.
At the beginning I suggested to use traffic lights instead of a Burndown Chart to show the team’s progress. Why?
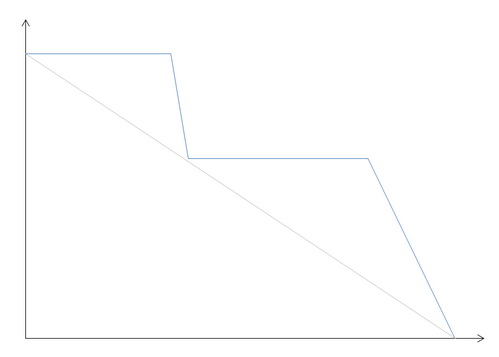
As the team is small, we do not have a lot of stories for the Sprint; only 2 to 3 per Sprint. I felt it was not very motivating to have a burndown chart that changes only 2 or 3 times during the Sprint (see below). Furthermore the developers used Scrum for the first time in a project and were rather skeptical about giving a commitment. (Due to bad experiences about effort in man-days commitments in the past.)
 Now there are no more traffic lights on the board. Why?
A much better agile coach than I am worked intensively with the team in the last week. He cleaned up. 😉 When I asked him where the traffic lights were, he answered: “The team commits on the Sprint goal and not on traffic lights.”
Of course, he is right. Although he understood my idea of a “Burndown Chart Substitute”, traffic lights only have a “binary” explanatory power: “Yes” – “No” (and maybe “Maybe”).
A Burndown Chart is much more than traffic lights.
It has the “binary” explanatory power of the traffic lights.
PLUS: It shows the progress of the team (no matter if there are a lot or just some stories), it visualizes the time (remaining & past days of the sprint) and it shows the amount of work still to be done (based on facts not opinion!).
The much better agile coach than I am missed to replace the traffic lights with a burndown chart. This will be my first ToDo on Monday. 🙂