Some team members are at war with Kanban metrics (and probably other metrics): What are Lead and Cycle Time for? What does a Spectral Analysis Chart (SAC) show? Why should we care at all about a Service Level Agreement (SLA)? (Especially when there are so many dependencies with other teams.) You can always quote David Anderson or Wikipedia, but simply quoting won’t make sense to everyone. To better understand what Lead Time and a SAC are and how those are connected to a (desired) SLA, I tried a playful approach with one of our Kanban teams: “Show me your Data!”

Preparations:
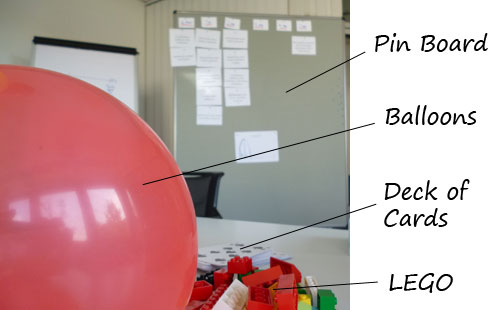
– You need a couple of balloons, 2 decks of cards, some LEGO and index cards in different colors.
– Furthermore you need Post-Its or index cards and label those with “1-10 sec”, “11-20 sec”, “21-30 sec”, “31-40 sec”, “41-50 sec”, “51-60 sec” and “> 60 sec”. Stick those horizontally on a pin board.
– Write 9-12 tasks on index cards (Here some ideas for tasks: Mixed deck of index cards should be a color-sorted deck of index cards, inflate 3 balloons, sort out all red LEGO bricks, build a 3-level house of cards etc.)
How to Play:
You play in cadences.
The cadence starts when presenting the team 3 tasks that have to be done.
After that a stop watch starts and the team are working on the tasks.
When a task is finished, a team member sticks the task card in the appropriate column of the pin board in order to track how much time was spent on the task until it was finished.
When all tasks are done and the according task cards have been stuck to the pin board, the cadence end with a short retrospective: How did that work? What could you observe?
You play several cadences, depending on how many tasks you have prepared.
Before the last cadence you should start with a first debrief:
Lead time is… (If you need some good explanation check here.)
The SAC is exactly what can be seen on the pin board. (mirrored horizontically)
Etc.
Now, supposing all those tasks were tasks of the team’s “Standard” service class, you can derive a SLA that results from empirical measurement of the tasks finished so far: 70% of all tasks will be done within 30 seconds (or whatever time the team needed for the tasks).
“So, let’s try to accomplish this SLA in the last cadence.”

The tasks in the last cadence should be a little harder: a 3-level house of Spade cards from an un-sorted deck of cards etc.
In this case the team can also discuss if it makes sense to split a task to finish the task within the SLA.
Why I think this game works:
It shows that metrics in Kanban measure the system and not the performance of the individual.
It explains very straight forward lead time and SAC and how to derive a SLA from those metrics.
If the tasks are not finished within the SLA, it is easy to discuss why that was the case and how the team could improve and deal with similiar tasks differently in the future.
I named the playful exercise “Show me your data!”. David J. Anderson mentioned in his “Kanban Advanced Master Class” I attended in November 2012 that this is what he likes to ask Kanban teams he is working with: “Show me your data!”
Contact me if you want to try this game yourself and need more information. (I did 4 cadences the last time and thought it was quite enough. It took approx. 60 minutes.)
UPDATE MARCH 2013:
I wanted to get some feedback on “Show me your Data!”, so I held a session at “Play 4 Agile 2013“.
Thanks for the honest feedback from the participants. 🙂
Here it is:
- Definitely a good exercise to explain how SAC works
- Easy to understand exercise
- When introducing exercise: Point out that you want to measure Lead Time (not Cycle Time).
- When introducing exercise: Point out that this exercise is not about WIP limit
- Don’t emphasize on SLA. Rather ask the team to encourage some Kaizen:
Why did the tasks above Average Lead Time took longer? How much longer did they took? How could we reduce the Lead Time of those tasks?